Corporate and Real Estate Investment Purchasing Patterns in the Allegheny County Housing Market
An analysis of 1—4-unit housing purchases in Allegheny County from 2010-2021
August 2023
From 2010 to 2021, the share of houses sold to corporate entities or real estate investors in the City of Pittsburgh increased from 15.5% of sales in 2010 to 24.8% of sales in 2021 while paying a fraction of the price of regular homebuyers. The remaining communities of Allegheny County experienced a similar increase from 9.7% of sales in 2010 to 18.0% of sales in 2021.
INTRODUCTION
Over the course of the last decade, major metropolitan areas across the United States have seen a significant increase in the number of housing sales to corporate entities and real estate investors. A recent study from RedFin, one of the real estate industry’s leading tech firms and researchers, showed that investors made up 18.4% of sales in the fourth quarter of 2021, a record dating back to the earliest reported data on corporate purchasing in 2000 [1]. Furthermore, renters also face concerns as studies indicate that corporate landlords are more inclined to increase rents, evict tenants, and inadequately maintain their properties compared to smaller landlords [2] .
In light of these national concerns, Senator Sherrod Brown from Ohio, Chair of the U.S. Senate Committee on Banking, Housing, and Urban Affairs, introduced: Stop Predatory Investing Act. According to the Stop Predatory Investing Act, if an investor acquires 50 or more new single-family rental homes after the date of the act's enactment, they will be prohibited from deducting interest or depreciation on those properties from their taxable income [3]. This measure aims to curb the advantages these large investors have in the market, as the deduction of interest and depreciation can significantly reduce their tax liabilities, giving them a competitive edge over individual buyers and smaller landlords.
Unfortunately, Allegheny County, and the City of Pittsburgh are no exception in this national story and face a rise in corporate purchase of houses. PCRG research shows that from 2010 to 2021, the share of houses sold to corporate entities or real estate investors in the City of Pittsburgh increased from 15.5% of sales in 2010 to 24.8% of sales in 2021, remaining communities of Allegheny County experienced a similar increase from 9.7% of sales in 2010 to 18.0% of sales in 2021. In this study, PCRG seeks to provide a greater understanding of this problem by examining the patterns of home purchasing at the census tract level from 2010 to 2021.
Key Takeaways
Of the 12 census tracts in Pittsburgh where the share of corporate purchasing is highest, 10 tracts had an average sale price under $75k, and the other two were tracts dominated by student populations in Central Oakland. The low average sale price can be indicative of the smaller, affordable housing units being bought out by corporate buyers.
Of the 43 census tracts in the remainder of Allegheny County with the highest rates of sales to corporate entities, 40 tracts had an average sale price under $75k, while the remaining 3 tracts were under the county average of $158,100.
In Pittsburgh and the remaining parts of Allegheny County, many of these census tracts with a higher share of corporate sales reflect historically Black and or Low- and Moderate-Income (LMI) communities. This could play a role in demographic changes in certain Pittsburgh tracts where the percentage of minority group population is decreasing over the decade.
On average, corporate entities paid 70.2% of the average sale price, compared to all purchases in Pittsburgh and 72.4% of the average sale price in the remaining parts of Allegheny County. The average sale price here is the average over the years from 2010 to 2021. The lower price paid by corporates can be indicative of corporate buyers putting forth cash offers or utilizing other techniques to surpass individual buyers and getting unfair deals on purchases.
Key Recommendations
Support federal policy proposals such as the Stop Predatory Investing Act, which would deny certain benefits to corporations which buy 50 or more than 50 new single family rental homes in a year. Pass the Neighborhood Homes Investment Act (NHIA), which would create a tax credit to incentivize the rehabilitation of single-family homes where the costs of the renovation exceed the value of the renovated home.
Adopt land use and land recycling policies that incentivize affordable homeownership opportunities, through new housing construction or housing rehabilitation efforts. Establish procedures and rights for land banks to be able to reallocate unused land resources equitably.
Ban unwanted solicitation of home purchasing without the permission of the homeowner and create more transparency in limited liability companies (LLCs) engaged in housing transactions at the city and county level.
Methodology
Cleaning Housing Transaction Data
PCRG tracked housing purchases in Allegheny County from 2010 to 2021 using the real estate transaction data from RealSTATs without adjusting dollar amounts for inflation. Transactions were then cleaned and formatted to include proper U.S. Postal Service address formats and correct spelling mistakes when possible. Because transaction data is given at the street address level or by city/municipality ward level, the data was geocoded and adjusted to the 2010 census tract boundaries (as this represented the boundaries for the bulk of the analysis period). This process was achieved using the U.S. Census Bureau’s free geocoding tool.
Additional factors that were used in selecting transactions included:
1—4-unit residential housing (including detached and semi-detached residential housing such as duplexes, condos, and townhouses);
Consideration market sales at a value of $1,000 or greater; and,
Street addresses that returned valid coordinates after geocoding and verified within Allegheny County.

PCRG flagged sales to corporate entities by removing governmental and non-profit entities from the study. Due to a high volume of corporate buyers and a wide variation of spelling within the original RealSTATs dataset, some entities may be duplicates. Across the county, without controlling for errors in spelling and non-profit status, there were 11,548 unique corporate entities identified as buyers. Furthermore, there are a large number of corporate buyers with unique names registered to the same property address.
An example of such phenomenon would include corporate buyers located at 829 Industry St, Pittsburgh, PA 15210. There are 237 housing purchases from 42 different corporate buyers located at this address. This includes groups such as:
Birmingham Holdings LLC - 38 purchases
SSHT Community Partners LLC - 36 purchases
Hilltop Redevelopment LLC - 11 purchases
RE360 SS Partners LLC - 7 purchases
Another example would be the real estate investing group SFR3 LLC, which purchased at least 275 properties across Allegheny County under various naming conventions from 2010 to 2021. This includes:
SFR3 030 LLC - 73 purchases
SRF3 000 LLC - 49 purchases
SFR3 LLC - 34 purchases
SFR3 030 LLC - 27 purchases
SFR3 040 LLC - 16 purchases
Additional Information from the U.S. Census Bureau
In order to adequately contextualize the census tracts with their populations and demographics, PCRG included the census population at the beginning and end of the study period. Because real estate transactions were geocoded to the 2010 boundaries, we used the Longitudinal Tract Data Base (LTDB) crosswalk for Allegheny County to reconstitute 2020 U.S. Census block group populations into 2010 boundaries.[3] This was successful with only a limited number of 2020 block groups being omitted. This occurred in municipalities primarily within Allegheny County that straddled into other counties. Doing so allowed us to show which neighborhoods showed significant changes in population and racial demographics from 2010 to 2020. Additionally, PCRG included each tracts’ income as a percentage of the Pittsburgh MSA area median income at the beginning and end of the decade.
Identifying Census Tracts Prone for Predatory Real Estate Investment Practices
PCRG created a list of criteria in order to better understand the areas that have experienced, or are more likely to experience, housing purchases by corporate entities and real estate investors. Each of these, as singular criterion might not give meaningful information about the vulnerability to predatory real estate investing, but the presence of more than 3-4 below-mentioned criteria can be a marker of vulnerability and a symptom of existing predatory investing practices. The seven areas include:
Low Income: at least one standard deviation below the mean for tract median family income;
Low Volume of Total Sales: at least one standard deviation below the mean in total housing sales from 2010 to 2021;
Low Average Sale Price: at least one standard deviation below the mean in average sale price for all sales from 2010 to 2021;
Low Corporate Sale Price to Average Sale Price: at least one standard deviation below the mean in average corporate sale price as a percentage of the average sale price of all housing from 2010 to 2021;
High Volume of Corporate Sales: at least one standard deviation above the mean in total corporate housing purchases from 2010 to 2021;
High Corporate to Total Sale Ratio: at least one standard deviation above the mean in corporate sales as a percentage of total sales from 2010 to 2021; and,
Low Market Activity (*): at least one standard deviation below the mean in housing sales per thousand residents in a tract, as of the 2010 U.S. Census, so long as at least one previous criterion is already being met.
Census Tract Analysis Results
These criteria only applied for census tracts that registered a housing purchase from 2010 to 2021. No census tract met every marker, however multiple tracts did reach a high of five of the seven total markers. In Pittsburgh, this included portions of Lincoln-Lemington and Homewood, as well as Wilkinsburg, Rankin, Braddock, and McKeesport in the remainder of Allegheny County. Other notable hotspot areas in the city include Arlington, East Liberty, Esplen/Sheridan, Larimer, Knoxville, and Mount Oliver neighborhood. Portions of Oakland are also represented, though this may be a function of the high percentage of students who live in the census tracts. In the remainder of Allegheny County, there are hotspots in Clairton, East Pittsburgh, and McKees Rocks. Furthermore, many neighborhoods and municipalities in the county fail to register any of the concerns listed above.
Statistical Results
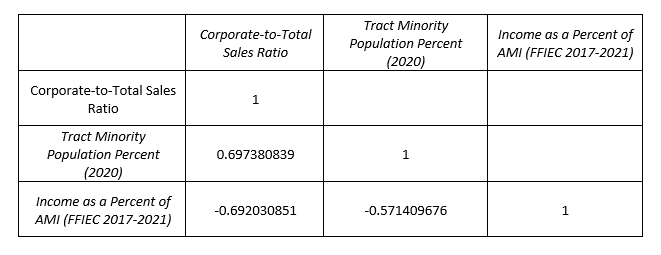
PCRG was interested in how the housing purchases of corporate entities and real estate investors affected communities, particularly historically minority or low-income communities that have been left behind in the housing market due to discriminatory policies like racial covenants and redlining. To begin, we examined the changes in census tracts minority population from 2010 to 2020. Unsurprisingly, we found that the percentage of minority populations in a census tract in 2010 was highly correlated with the percentage of minority populations in a census tract in 2020 (an r-squared value of 0.9293).
Similarly, we compared the tract median family income as a percentage of the area median income at the beginning and end of the decade, provided by the Federal Financial Institutions Examination Council (FFIEC). We used the FFIEC income information, as this is typically used by lenders to determine the low- and moderate-income (LMI) status of census tracts and borrowers for the purposes of Community Reinvestment Act (CRA) activity. We found that the income level of census tract at the beginning of the decade was correlated with the income level at the end of the decade, though at a slightly lower value than the correlation with the percentage of minority populations (an r-squared value of 0.7997). In essence, we find this data to show that the racial composition of a census tract was highly unlikely to change over the course of a decade. The economic conditions were also unlikely to materially change in that same period, though not to the same extent as the racial composition of a tract.
In the graph above, the outliers or the census tracts that witnessed the highest change in the minority population and income level of the population are the points that are furthest away from the black line.
When we introduce the sales to corporate entities as a percentage of total sales in each census tract from 2010 to 2021, we find that there is a moderate positive correlation with the percentage of minority residents at the end of the decade and a moderate negative correlation with the income level as a percentage of the area median income at the end of the decade. In layman’s terms, corporate sales tend to increase within more minority communities, and corporate sales tend to increase in lower-income communities. However, it is important to note that correlation does not imply causation, and further study is required to understand if higher corporate sales affect the income level and minority population of an area or vice versa.
Learn More About the Corporate Buyers Operating in Your Community
PCRG has put together a tool to search through all corporate entity purchasing within a given census tract from 2010-2021. If you would like to learn what census tract you live in, use the FFIEC Geocoding Tool to find out. Open the tool here and select "2021" as the year and enter your street address. Your census tract is a combination of the state code, county code, and tract code - minus the period, as seen in the graphic below.
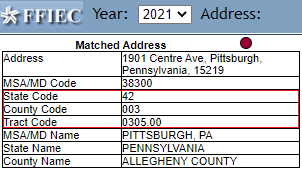
The census tract for the address above would be 42003030500.
After selecting a tract you will find the following information listed in the report section:
Tract Level Information
Tract MFI (%): the tract median family income as a percentage of the area median income
Income: the income level as determined by the FFIEC in a given year (low, moderate, middle, or upper income)
Population: the population as determined during the FFIEC reporting year
Minority Pop. (%): the percentage of the population that identifies as a minority race/ethnicity during the FFIEC reporting year
Average Sale Price: the average sale price of all transactions within the census tract from 2010 to 2021
Corporate Purchasing Information
Year: the year in which the sale took place
Corporate Buyer: the entity listed on the deed of the purchase
Street Address: a partially scrubbed address containing the street, municipality, state, and zip-code of the purchased property
Use Code: the use code of the purchased property
CDO - condominium or townhouse
DBL - a duplex, triplex, or multiplex
RES - a single family, detached residential unit
Price: the final sale price listed on the deed of the purchase
Corporate-to-Average Price: the final sale price on the deed as a percentage of the average sale price for all transactions in a census tract of a given year.
References
[1] Bokhari, S., & Anderson, D. (2022, April 6). Real estate investors are buying a record share of U.S. homes. Redfin Real Estate News. https://www.redfin.com/news/investor-home-purchases-q4-2021/
[2] Kasakove, S. (2022, April 23). Why the road is getting even rockier for first-time home buyers. The New York Times. https://www.nytimes.com/2022/04/23/us/corporate-real-estate-investors-housing-market.html
[3] BROWN, COLLEAGUES INTRODUCE BILL TO CRACK DOWN ON BIG CORPORATE INVESTORS THAT BUY UP LOCAL HOMES, DRIVE UP HOUSING PRICES. Sherod Brown, US Senator for Ohio. (2023, July 11). https://www.brown.senate.gov/newsroom/press/release/sherrod-brown-colleagues-bill-crack-down-corporate-investors-buy-local-homes-housing-prices
Acknowledgements
PCRG would like to acknowledge John Connor Boyle, who conducted research for this study prior to its publication. Additional contributions made by PCRG Research Analyst, Duta Bhatt and Policy Director, Chris Rosselot.
The findings, conclusions, opinions and recommendations expressed in this research study are those of PCRG. PCRG retains full ownership of the intellectual property rights associated with this study.